Curriculum Links
Digital Technologies Curriculum Information
0. Checklist
1. Data in our Lives
Role that data plays in their lives
2. Representing Data
Structured data to model objects and events that shape their communities
3. Working with Data
Acquire, analyse, validate and evaluate various types of data
4. Introducing Spreadsheets
Recap – storing and transmitting data in digital systems recognising the difference between numerical, text and date formats in spreadsheets
5. Basic Excel Skills
6. Google sheets
7. Sorting & Filtering
Applying a set of conditions to a spreadsheet to organise and filter data, for example using conditional formatting to highlight the state of particular cells, and filtering and sorting categorical data using column filters
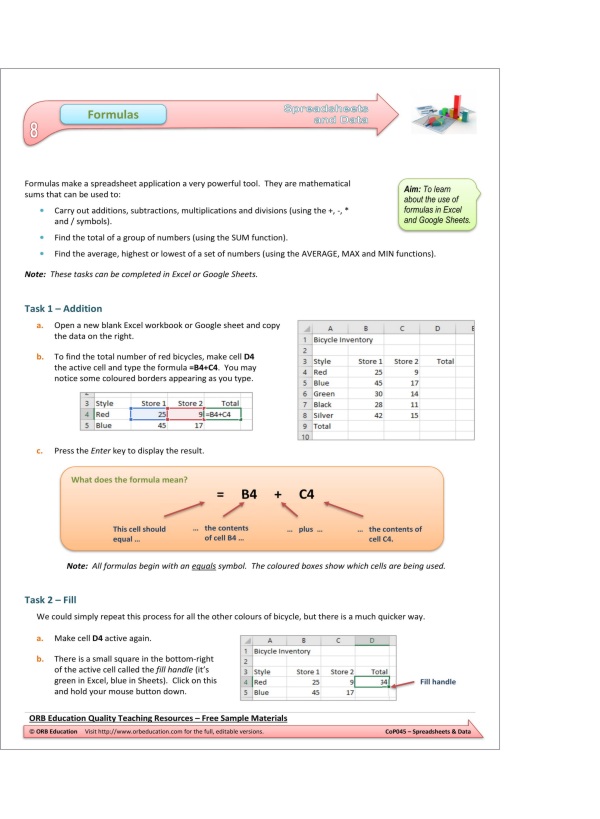
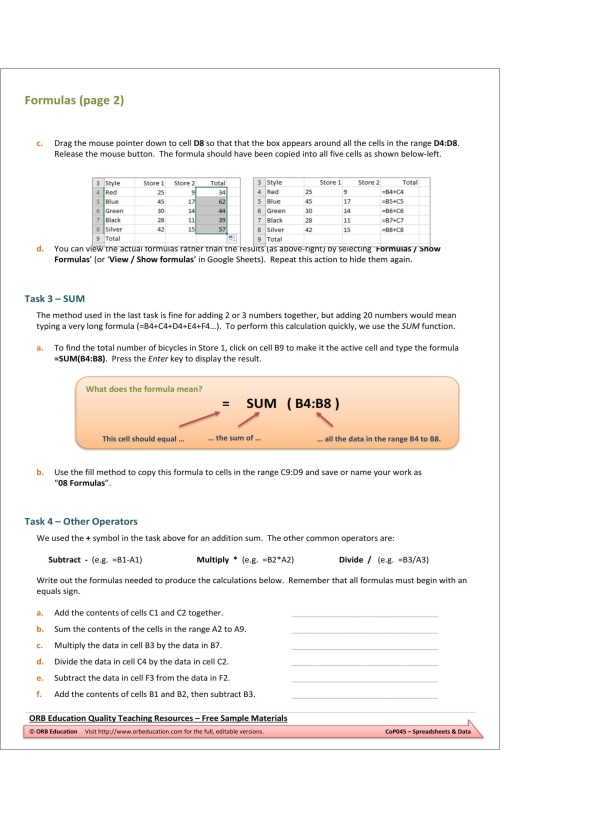
8. Formulas
Using software to automate calculations to help with interpreting data, for example using functions to make arithmetic calculations using multiple cells and summing cell ranges
9. Plots and Trendlines
Recap – using data visualisation software to help in interpreting trends, for example uploading data to a web application and building a visualisation of the dataset
Visualising data to create information, for example identify trends and outlier data from spreadsheets using plots, or displaying geocoded data on a map
10. Spreadsheet Practice
Recap – selecting and using peripheral devices suitable to the data, for example using a data probe to collect data about changing soil temperatures for plants, interpreting the data and sharing the results as a digital graph
11. Basic Web Searches
Recap – acquiring data from online sources by narrowing the focus, for example filtering data using provided options or performing queries using advanced search functions
12. Collaborating on Spreadsheets
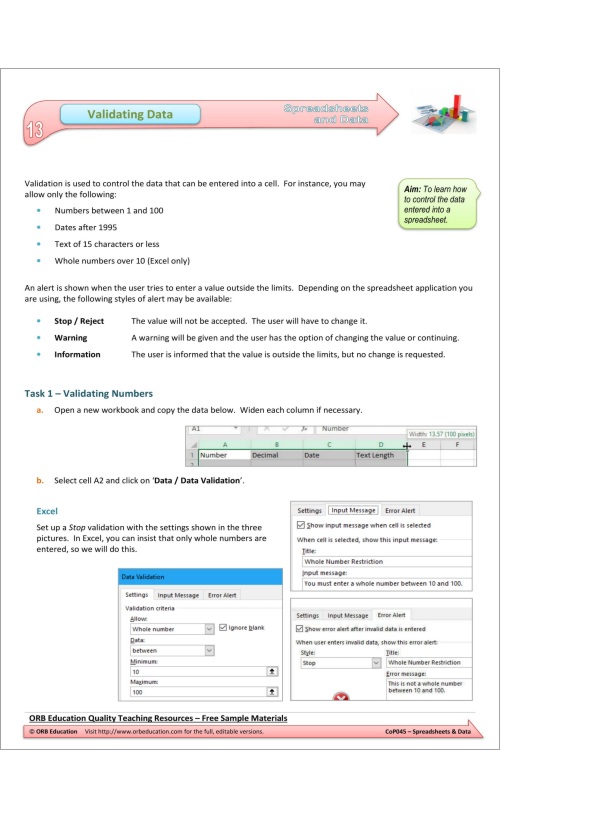
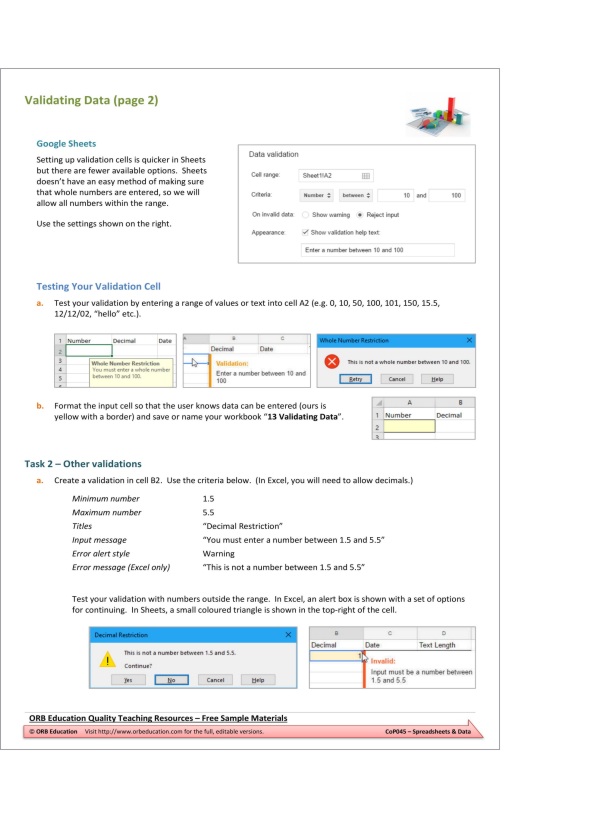
13. Validating Data
Recap – using digital systems to validate data, for example setting data types in a spreadsheet to make sure a date is input correctly
14. Data Authenticity
Acquire data from a range of sources and evaluate authenticity, accuracy and timeliness (ACTDIP025)
Checking authenticity of data, for example ensuring the source or author is a reliable individual or organisation
Acquiring data from a range of sources, for example people, websites, books, mobile phones, radiofrequency identification (RFID) and data repositories such as the Australian Bureau of Statistics datasets, and compiling these data into a digital format
Designing a search engine query to find specific information on the web and checking its accuracy against information contained in other sources, for example entering instructions such as intitle: and inurl: prefixes to find information within a general directory, and comparing the results with information found in a wiki
15. Algorithms and the IF Function
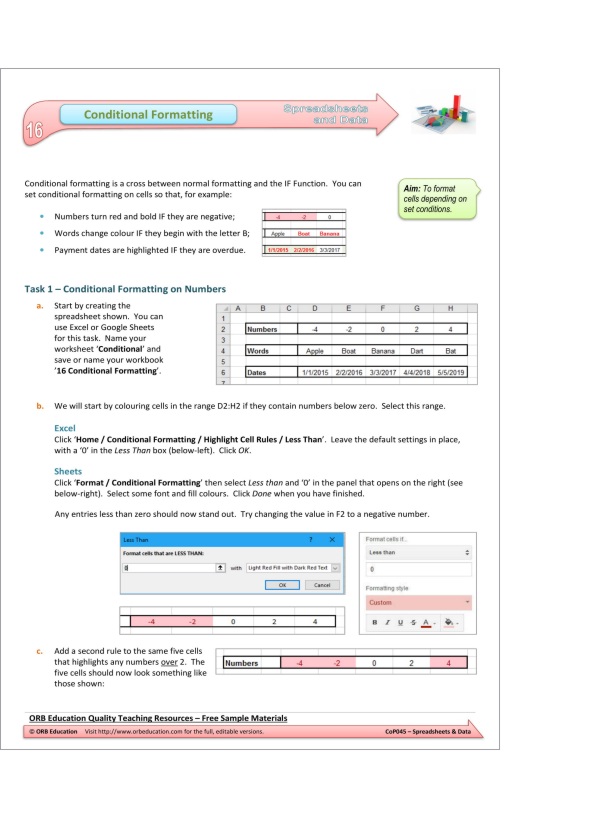
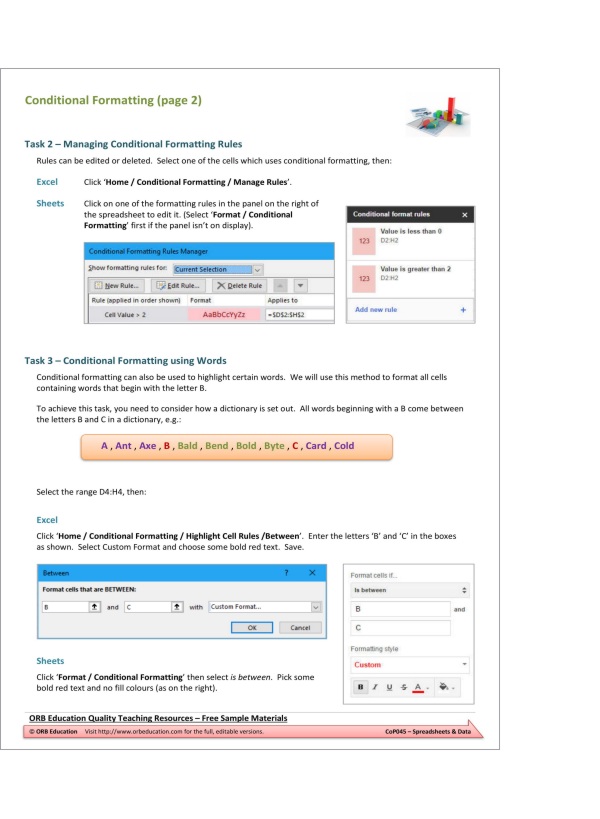
16. Conditional Formatting
Applying a set of conditions to a spreadsheet to organise and filter data, for example using conditional formatting to highlight the state of particular cells, and filtering and sorting categorical data using column filters
17. Financials
Using features and functions of software to summarise data to create information, for example calculating a simple budget of income and payments and creating a summary table for analysis
18. Pivot tables
Explore different ways of showing the relationship between data elements to help computation, such as using pivot tables, graphs and clearly defined mark-up or rules.
19. Copying Data from the Web
20. Exporting Data
Explaining ways media elements are presented, for example the difference between embedded and linked media elements



Reviews
There are no reviews yet.